
 RSS
RSS

Text is a refined type of talking. It involves an extra level of complexity, since reading and writing require some 7 years for a child to master, what with learning alphabets, reading, writing, and the composition of sentences, paragraphs and proper essays. The payoff from this investment is that written messages are compact, efficient, skippable, and eternal. Good quality ink on proper paper can last 500 years with reasonable care in a library. Every few years I look at the Salisbury Magna Carta, readable on vellum after eight centuries. Reading is a fast way of grasping the essentials of an idea, particularly when the writing has been very carefully considered. Words are tools of meaning.
I favour writing over talking because it is more precise, and easily editable. Ambiguities can be detected and corrected. Writing can be edited, errors quickly corrected.
However, speech is the more usual method of human communication. It seems to require no teaching at all, beyond immersion in the society of other talkers. A functional competence emerges in a few years, one of the wonders of human learning, and although vocabulary keeps increasing with the passing years the average 7 year old can give a good account of daily events, and understand much of the basics of language.
Speech reaches a wider audience, since not everyone reads, and listening is often easier than reading when there are other tasks to be done, or when concentration is fading. Ideally, speech can serve as the gentle introduction to deeper reading, a setting out of wares which might encourage some to take a longer look at a particular subject. This is particularly the case when you want to comment in general terms immediately, knowing that writing things up will take too long, or might even never get written up at all.
So, faced with a week in which many interesting papers had been published or publicize again, here is my attempt to supplement written accounts with some spoken commentary. Let me know what you think of it, and if you find it OK, recommend it to those who you think might listen to it.
Additional Notes
The Piffer equation is explained in my last post, and Piffer has added that the new correlation between his prediction and the observed genetic group means is 0.9
The bird migration paper is here, and turns out to be a 2010 study, recently in the news again:
http://journals.plos.org/plosone/article?id=10.1371/journal.pone.0009617
The paper on free diving and larger spleens is here:
https://www.cell.com/cell/fulltext/S0092-8674(18)30386-6
The iris response aspect is in another study
By the way, the selective change to the iris is contraction to pin hole size for better focus, not expansion for greater light. My error. Easy to edit in text, hard to change on a video.


Great video/commentary, Mr. Thompson!
Spleens etc: a few weeks ago – or maybe months ago – on Cochran’s blog somebody asked for examples of humans evolving to suit environments with a shortage of oxygen, so I suggested pearl fishers. My memory is that the idea was pooh-poohed. Ha!
The claimed correlation of 0.9 is a stunner: my first reaction would be a cry of What!? If arithmetic error is ruled out then I’d look for evidence of circular reasoning. I have in the past seen a plot of experimental data that looked wonderful but which, on analysis, turned out to be a case of the worker plotting x versus x, having first confused himself by combining x with other variables in two different ways that hid from him the essence of his procedure.
I liked your bird story. Any example that might require the politically correct to imply that mankind is immune to the evolutionary pressures that affect all other living things is a source of potential glee.
I commend your delivery to camera – I much prefer that to the bogus bonhomie and staginess of an interview. Good stuff, Doc. Thank you.
What test can be done to verify assertion that said hypothesized adapation is not a byproduct and vice versa (regarding the supposed adaptation of the ‘sea gypsies’)?
All true, but in our fallen world, it seems videos have innately better reach.
For instance, Molyneux or our RAMZPAUL are more high profile than Steve Sailer or The Derb, which is pretty depressing considering how long the former have been at it relative to the latter.
Some of my colleagues and I launched a half-assed alt right Russian podcast a year ago. YouTube channel already approaching 10k subscribers.
I could see weekly discussion of the state of IQ research going places, especially if you do some very basic video editing to intersperse it with graphs from the papers you’re talking about, have occasional guests, etc.
The Alphabet Versus the Goddess: The Conflict Between Word and Image
https://en.wikipedia.org/wiki/The_Alphabet_Versus_the_Goddess
How the Invention of the Alphabet Usurped Female Power in Society and Sparked the Rise of Patriarchy in Human Culture
– https://www.brainpickings.org/2014/03/17/shlain-alphabet-goddess/
The Alphabet vs. The Goddess Lecture by Dr. Leonard Shlain
Video Link
Great stuff. I suspect I wouldn’t have bothered reading about the three subjects but was more than happy to listen to you talking about them. More please.
Thanks for the update. I tend to prefer text, but one nice thing about YouTube is the automatic transcript generation. The quality is pretty good these days (modulo things like Davide Piffer not being in their training set ; ) and the ability to text search and jump immediately to that spot in the video is handy.
The genetetic change in the case of the divers has happened fast – and that’s what’s usually ridiculed, isn’t it? The expolsive aspect of Harpending/Cochran’s thesis?
I would be very interested to see how the opponents of this findings react.
(The video is great, thank you! – (I say that as a firm believer in writing things (thoughts) down)).
thanks. Yes the 0.9 correlation is striking. We just have to find what is wrong with it, if something is.
Text is a monologue. Talking can be a dialogue.
great evo bio summary – perfect listening at 1.5 speed for us impatient types:)
wonder if body size would add to prediction above & beyond brain size re: bird migration?
great blue herons stay here all winter, but egrets go south.
wonder if brain size factors in to all the US boomers who go south in the winter (kidding:)
The Miami effect? Worth studying
The vision thing seems to be a trainable skill, not genetic effect, according to follow up study by same authors.
https://www.sciencedirect.com/science/article/pii/S0042698906002367
Or maybe our brains are just wired for speech. We’re born to talk; literacy is only a few thousand years old.
Said the fellow engaging in text dialog via comment system.
You bring up a very interesting question: can some people have been evolved by money? has it been around long enough?
Jews would be the obvious suggestion. Perhaps, most Europeans were though. But that would probably be gene frequencies of very complex, polygenic traits. I wonder if it is possible if there were any de novo mutations which had dramatic effects.
I liked it a lot. I liked the simple three-main-points structure, the conversational tone, and above all the brevity. In fact, an occasional feature like this might be the missing ingredient of a blog like yours. You are never going to appeal to the people who read at the speed of speech, but this could be the equivalent of Razib on capsaicins or Sailer on golf courses, the hook which persuades high speed skimmers to stick around and read a post twice, and read it slowly.
Mr. Thompson,
I would be extremely interested in your opinion on the following paper:
– https://www.unz.com/article/americas-cultural-revolution-the-obsession-with-self-esteem/#comment-2309020
The “new” tool was well applied. Your face, and impression of personality is well expressed. Such a snippet of graphics is welcome.
Concerning subjects in depth, more complex fields of cognizance, written text does the best job.
Single spoken snippets, and their transcripts would make identity Thompson more acceptable to most, but would dumb obligatorily the density and level of content. Maybe a once in a while short three dimensional impression, and the main bodies in black and white?
Writing is slower then speaking, but can be read associatively, allows for complex ideas, has a long and revisiteable lifespan and a ream of referencing possibilities.
If there is original content, a data search allows for phishing relevancy and author propriety. A ream of other secondary benefits. The question whether writing as to be viewed digitally or analogically on paper is none. Digital text should be formatted as to be easily reproduced in print. True, almost all formatting tools fail in applying this concept, including the Unz effort in presenting a digital body of which print is hard to extricate, and mining is hard to perform. There is a lot of confusion in the field of consistent formatting, and how to do so, a single example: references used in conjunction with links in digital pages can be very confusing, numbered references, and indexing are analog tools, a simple browser “/somesearchterm” is the way to get at anything in the most significant way.
Reading is certainly faster then listening, and this really matters, even for those who read linearly and do not use the simplest processing of text “scanning”. This does not oppose the slower writing then speaking, since the necessity allows for polish and deep.
All true, in the name of popularization. Does popularization do what exactly, does it extract hidden talented individuals of an otherwise insignificant life, does the impact they then can have on their immediate flat leveled near environment matter? Or is there any hope, that popularized content serves anything else then infusing fire-hose interested concepts on the masses?
The answer to the first, as an initial stage of incentivizing, could be yes. The second concept, bringing general comprehension up some points definitely seems contradicted by far dumber environmental experiments(Syria, Novichok).
As to reaching out to outliers, individuals that for a multitude of reasons, their poor environment, by circumstance poor formal education, time to maturity, other external pressures(earning a living by base employment), anything that was left out by “meritocracy”, testosterone and youth for that matter, would the big hurdle to development not be tearing down the paying firewall between quality content and stoppage to references of conventional sources of knowledge only, both. Your friend Emil O. W. Kirkegaard is an example of stating openly the concept of the latter.
It is pityful to see the association mostly between “public” and “intellectual”. It mostly means the interpreter is not so much pressured by the cognitive capacity of his public then by the pressures to follow and trace the directives of conventionality and de facto power elites.
I ain’t Doc T, but here’s my tuppence worth on Burt.
(i) It is alleged that he lost much of his data in a bombing raid on London and thereafter faked his evidence. I don’t know this to be true but I’ve no particular reason to doubt it.
(ii) During the attack on Burt over this matter, one major accusation was that he faked the existence of two female research assistants. Long ago I knew a young research assistant who worked for an older man, a psychologist of that era who was familiar with Burt and his work. He told her that he had himself met one of those allegedly non-existent assistants of Burt, so that the knew the accusation to be at least 50% false. She asked him whether he was going to make his evidence public. He explained that he’d be mad to do so since he would then be subjected to intense bullying.
The best sources of data on the distribution of intelligence are entire populations samples. Ian Deary and the team in Edinburgh have very good data on these distributions. I would leave Burt out of it.
Thank you very much, and to dearieme, too.
Just found a great article on the topic:
Biased Tidings
The Media and the Cyril Burt Controversy
by Kevin Lamb
The Mankind Quarterly, Winter 1992, pp. 203-226
https://www.unz.com/print/MankindQuarterly-1992q4-00203/
Alternative links:
Link: http://euvolution.com/euvolution/biased.html Archived link: http://archive.is/kDOuX
Interesting. Decades ago when I was but a young researcher, an older cove told me that a Distinguished Researcher had invented the data, or much of the data, in one of his better known papers. The aforesaid cove knew about it because the Distinguished Researcher’s post doc was unhappy to have his name attached to fraudulent data and so had spilled the beans, hoping for useful advice. “Did nobody spot it as faked?” I asked. “No; it probably wouldn’t have stuck out. His intuition was very good; the faked data were probably pretty close to what an honest man would have measured.”
And what advice did the cove give to the post doc? Keep your mouth shut, find a new job somewhere else, and never return to work for this crook.
Is crooked behaviour rare? In mid-career I was warned by two independent sources that a Very Distinguished Researcher had heard about one line I was pursuing, and that going by his past form he would approach me, propose collaboration, then swipe my ideas and data, and claim all the credit. I took the hint and repelled his approach. And then only a few years later the same scenario played out again: a different line of work, a different Very Distinguished Researcher, two different independent sources, but identical warnings. This was when I coined my aphorism that to become disillusioned one must first have been illusioned.
Here another study that is highly interesting and, intuitively and based on my real-life experiences, makes much more sense to me than “normal” distribution:
The Best And The Rest: Revisiting The Norm Of Normality Of Individual Performance
– https://www.researchgate.net/publication/263263095_The_Best_And_The_Rest_Revisiting_The_Norm_Of_Normality_Of_Individual_Performance
Put Away The Bell Curve: Most Of Us Aren’t ‘Average’
– https://www.npr.org/2012/05/03/151860154/put-away-the-bell-curve-most-of-us-arent-average
Source: http://www.businessinsider.com/new-study-debunks-idea-that-human-performance-fits-on-a-bell-curve-2012-5
This is exciting stuff!
I found another great paper:
MAJOR GENES OF GENERAL INTELLIGENCE
VOLKMAR WEISS
Link: http://www.v-weiss.de/majgenes-full.html Archived Link: http://archive.is/blV7b
Where polygenic theory predicts a normal distribution of ability among siblings of the same family, major gene theory predicts that the IQ distribution of the offspring of homozygotes (either M1M1 or M2M2) and their spouses (much of them M1M2 in any case) should be quite markedly skewed (and the skewness should be in the opposite direction for M1M1 offspring compared to M2M2 offspring). In a representative sample (Nuttin, 1965) of Dutch speaking Belgian children (n = 1514; 5-6 years old), 6% of the fathers were classified into the upper educational and occupational level, 38% in the medium and 56% in the lower. Percentages and classifications are not identical with our (Weiss, 1982) findings, but there is a remarkable similarity. The IQ distribution of children exhibits the predicted skewness (see Fig. 1).
Major gene theory always predicts a certain distribution and segregation. A general review will find dozens of studies and distributions of past studies with IQ tests far from normal. However, because there was no alternative theory of IQ, chance or lacking representativity was the only answer, preventing any deeper critical insight. An especially striking example is Herrnstein` s (1973) interpretation of the World War II Army General Classification Test published by Stewart (1947): “The average values of the single occupations are dispersed from 129 to 85, and inbetween we see the wellknown bellshaped distribution curve” (see Fig. 5). I see a bimodal distribution with the modi about IQ 94 (M2M2) and IQ 112 (M1M2). Near the IQ 100 modus of a normal distribution about 6000 probands are lacking. (A M1M1 modus around IQ 130 was impossible, because officers were not tested.)
Encouraged by such empirical facts, in 1982 Weiss (1982a and 1982b) published a preliminary sketch of the distribution of test raw scores for the overlapping genotypes M1M1, M1M2 and M2M2 (see Fig. 4).
As a consequence of the relationship between speed and capacity (Spielman et. al., 1978) Weiss put forward the hypothesis that between the scores of the means of the three genotypes would always exist a linear relationship with the heterozygotes M1M2 exactly intermediate between the homozygotes, if information processing would be measured in bits, that means on an absolute physical scale. Only several weeks after the publication this hypothesis could be confirmed by Lehrl and Frank (1982).
[…]
The crucial question is, what are the evolutionary forces which have stabilised and are still balancing (Weiss, 1990b) such a frequency of about 5% high IQ individuals and about 27% heterozygous individuals and hence a general population mean of about the same level in Mongoloids and Caucasoids? In developed societies high intelligence of a person seems to be of such an advantage, that one wonders why the major gene M2 responsible for lower normal intelligence has survived with a frequency of about 0.80.
A relatively stable social hierarchy needs a small number of high IQ individuals at the top, a greater number of individuals of average intelligence for the middle positions, and a large number of low IQ individuals to perform modest routine work at the bottom. In modern societies M1M1 individuals invent machines, M1M2 repair machines, and M2M2 operate machines. Any hierarchical society can only tolerate a very small percentage of high IQ individuals in relatively humble social positions, because such individuals represent always, in view of the limited number of leading positions, a potential threat to the ruling elite. In economically dynamic societies there is always periodic turbulence, and the antagonism between ruling and powerless high IQ-individuals, i.e. the struggle for leadership of the majority, is the most potentially destabilizing factor, not the direct challenge to the ruling elite by the low IQ majority itself. All societies have to have a hierarchy with a relatively fixed ratio of leading to nonleading positions.
Bar the amateur athletes, all the others mentioned in the first study above are selected samples. Population samples, such as the Scottish National samples, the Isle of Wight studies, and the major conscript studies are all close to the bell curve.
A normal distribution, but the way, is entirely consistent with intellectual super-stars.
Read Rindermann on the smart fraction.
https://www.unz.com/isteve/rindermans-smart-fraction-paper/
I’ve just seen a rave review of The Mind is Flat: The Illusion of Mental Depth and The Improvised Mind (available now at Amazon UK; later in the year in the US). Tell me, Doc, do you know the work of the author, Nick Chater? Is he someone I should read? Does his work offer any insights relevant to your own research interests?
If his thesis is true, it will be a shallow book. Best avoided.
Volkmar Weiss is enthusiastic about DUF1220 as seen at the summary version of your link: http://www.v-weiss.de/majgenes.html
It sounds like he sees it as the realization of his major gene idea. Which sounds fairly plausible to me. The question is how much of the variance would something like that explain vs. the polygenic SNP aspect? If height is any guide there should be significant non-additive SNP variance to be explained. (note 3% New Zealand estimate in my linked comment below)
He links an interesting article (which eventually goes off the rails a bit into aliens): http://www.collective-evolution.com/2014/10/13/junk-dna-or-does-it-reveal-the-source-of-our-mind-intelligence/
I like the figure there.
The original source of that figure is https://www.researchgate.net/publication/230841831_Evolutionary_History_and_Genome_Organization_of_DUF1220_Protein_Domains
A 2006 blog post about DUF1220: http://johnhawks.net/weblog/reviews/genetics/brain/duf1220_duplication_expression_2006.html
Link back to my earlier DUF1220 comment: https://www.unz.com/jthompson/cognitive-capitalism-2/#comment-2290818
Dr. Thompson, any thoughts on how Weiss’s ideas are received in the intelligence research community? He gives a 1991 Arthur Jensen quote which sounds enthusiastic but unconvinced: “Whether Weiss’ s theory is true or false, which remains a very open question at present, this article seems to me an impressive effort that deserves full exposure to a wide audience. … In fact, this is the first article I’ve read on a major gene theory of g that has made me think there might possibly be something to it. If it were adequately proved, of course, it would be a truly major advance.”
This is a persistently popular idea. I suppose that is because it is observationally true in many contexts. It is just that the conclusion drawn (overall distribution is a power law) is probably not true. Dr. Thompson calls out the obvious problem (highly selected groups) with the analysis.
I wanted to look at this quantitatively with a simulation so I created a normal distribution selected at +3SD in R. The resulting distribution fits a power law fairly well visually. If anyone is interested I can post some code. I’ll probably try doing some further analysis since power law and log normal distributions can look alike. For example, see figure 2 in https://cran.r-project.org/web/packages/poweRlaw/vignettes/c_comparing_distributions.pdf
I should also try this with different thresholds.
If anyone else wants to look into this, this page provides a good start: https://github.com/csgillespie/poweRlaw
It is worth noting that the original point (non-normal talent) is worth making in a more qualified fashion. It just depends on the context and the intent of the distributional analysis.
Perhaps the most interesting thing is that this:
is pretty much the opposite of the IQ threshold idea. I know which one looks more accurate to me in my real life observations ; )
Thank you very much for your feedback, Mr. Thompson. It is highly appreciated.
I had a look at the following paper:
Does the Normal Curve Accurately Model the Distribution of Intelligence?
Lindsey R. Godwin, Kyle V. Smith
– http://www.ncurproceedings.org/ojs/index.php/NCUR2012/article/view/159/164
There is however an anomaly in that paper, in my opinion (my emphases):
Guldemond and his coauthors used the data that were collected in the first three years of the study for their study. The sample included about 13,000 students who completed the Groningen Intelligence test for Secondary Education (GIVOCtest), a Dutch intelligence test, and was a representative sample of Dutch school children. Based on the scores of the intelligence test, the students were categorized into four levels of intelligence: students that scored an IQ of 144 or better, students that scored an IQ of 130-143, students with an IQ of 120-129, and students with an IQ between 110 and 119.
It was projected that on a normal distribution there would be about 22 students (21.80) with an IQ of 144, and there were 20 found. It was also projected that there would be about 318 (317.55) students with an IQ higher than 130, and there were 342 found. It was projected that about 1,503 (1,503.29) students would be found with an IQ over 120 and there were 1,286 found. Lastly, it was projected that about 4,786 (4,785.70) students found with an IQ higher than 110, and 3,462 were found.
The projections and the actual number of students with an IQ over 144 were fairly close; and there were more students than projected that had an IQ over 130. However, there were far fewer students than projected with an IQ over 120 and even more fewer than projected with an IQ over 110. These results may not show a clear pattern, but they do show that with the exception of students found with an IQ over 120, that intelligence seems to generally conform to the distribution of a normal curve.
that is, I believe, actually in line with/confirms Weiss’s distribution theory:
In 1978 softening of the communist ideology in East Germany (Weiss, 1991) made it possible to test a sample of 124 mathematically highly gifted youth (Weiss, 1979a) selected on the same basis as in 1970. The mean IQ of this sample was 135 plus or minus 9 (compare Table 6) corroborating in such a way the IQ estimates made on the basis of occupations (Stewart, 1947) , degree of selection and comparison with other authors (Terman, 1925). Additionally, it was possible to test another sample of 274 gifted subjects who were enrolled in special forms with extended lessons in Russian language. The distribution of this sample was clearly bimodal with one modus approx. IQ 112 (M1M2), the other approx. IQ 130 (M1M1). For the sake of comparison in Table 6 the distribution of the representative sample by Horn (1962) for children of the same age from 15 to 18 years is also given.
[…]
Encouraged by such empirical facts, in 1982 Weiss (1982a and 1982b) published a preliminary sketch of the distribution of test raw scores for the overlapping genotypes M1M1, M1M2 and M2M2 (see Fig. 4).
Mr. Sailer and commenter James Lee commented on this topic several years ago:
The Bell Curve or The Bimodal Distribution?
Arnold Kling
– Posted January 3, 2012 3:07 PM http://econlog.econlib.org/archives/2012/01/the_bell_curve.html#178561
– Posted January 3, 2012 9:06 PM http://econlog.econlib.org/archives/2012/01/the_bell_curve.html#178630
Weiss was predicting this 80/20 rule and the natural selection for and evolutionary wisdom behind it:
– http://www.v-weiss.de/majgenes-full.html
I wrote about this problematic dynamic in regards to highly selective, higher-IQ/-ambition immigration, which is profoundly destabilizing for a country, here:
– https://www.unz.com/freed/iq-a-skeptics-view/#comment-1731013
I think we are only getting started in the U.S. with this destabilization process and “antagonism between ruling and powerless high IQ-individuals”…
Yes 😉 I saw that in the Appendix:
– http://www.v-weiss.de/majgenes.html
Here is what commenter Dee commented a while back, Weiss might be the candidate for that Nobel Prize:
– https://www.unz.com/isteve/four-decade-dunedin-study-shows-how-to-predict-future-social-costs-of-individuals/#comment-1691825
I saw it more as the opposite of the “collective/group intelligence” idea: https://www.unz.com/jthompson/group-iq-doesnt-exist/
It is interesting also that groups did not perform better than individuals – a genuine group-IQ might be expected to enable problem solving to scale linearly (or better) with number of subjects. In group-IQ tasks, coordination costs appear to prevent group problem-solving from rising even to the level of a single individual’s ability. This implicates not only unsolved coordination problems, which are well-known barriers to scale (Simon, 1997) but also reiterates the finding that the individual problem-solver remains the critical reservoir of creativity and novel problem solution (Shockley, 1957).
– https://www.unz.com/jthompson/group-iq-doesnt-exist/#p_1_29:1-51
Thanks for all your very insightful and valuable feedback, res.
That is a good point. Maybe it is less the opposite of either than a strong counterpoint to both?
Thanks. Thank you for some very interesting comments. Some can be a bit overwhelming at first, but often repay careful reading.
P.S. I am a bit disappointed with my R normal curve/power law simulations. Some thoughts on that:
– Obviously an IQ distribution including parts of the below average region does not look like a power law because of the hump at the mode.
– The normal distribution from 100-130 (0-2SD) has substantial curvature on a log frequency plot (power law is a straight line).
– The normal distribution from 2-4SD still has some curvature but is the part which looks most like a power law to my eyes.
– Above 4SD the fitted exponent is substantially larger than in the other two cases and even so the normal distribution falls off more quickly.
So overall, depending on the rigorousness of the power law observations, I don’t think a truncated normal distribution is enough to fully explain the appearance of a power law.
Some real-life effects of the selection processes. To be listed on the FIDE list the chess player must have ELO rating of ≥ 2300. The distribution of Russians in the list,
http://tinypic.com/view.php?pic=2m4en11&s=9
Does that mean that the distribution of the Russians’ ability on chess is pareto and that in general no Russians score below ELO 2300? Some people are just guillible.
The global WESPA scrabble score is filtered by wealth and not IQ.
log(NTopScrabble/PopM)= +0.0446*IQdb -5.49 ; #n=22; Rsq=0.125; p-val=0.107 (NotSig)
log(NTopScrabble/PopM)= +18.3*WealthPCM ; #n=20; Rsq=0.256; p-val=0.02287 * (Sig)
The scrabble ELO score distribution for England (many British are rich enough) resemble a normal distribution,
http://tinypic.com/view.php?pic=5r437&s=9
However, to have an ELO rating the player must competes in international tournaments. The number of top players is significantly affected by the social economic levels of the developing countries and they require money equivalent to the international values for being members of recognized international associations, international travels, tournament entry fees, and fees for listing on the ranking tables, etc. Players from developing countries also have the added problems of getting entry visas unless they have credit reference reports from internationally recognized banks. Thus the number of moderately high performers might be greatly reduced. The effects can be seen from the ELO scores distribution from Nigeria
http://tinypic.com/view.php?pic=1607fcn&s=9
Taken at face value ignoring the long left hand tail, it will appear that the average score for Nigeria is higher than that for England. However, it is pretty clear that the number of registered players drop off rapidly below 1200, i.e. it is not financially justified for Nigerians in that range to be involved. Suddenly it is better to describe the Nigerian distribution with pareto distribution. The average score for Nigeria should not compares directly with that for England.
intelligence is fairly normally distributed within most population groups. besides for when measuring entire populations as mentioned above — major IQ test publishing companies collect extremely rigorous standardization data (including stratification by more variables than necessary! & randomization is also built into the process – it’s more anal retentive than anyone would think it should be). the normal curves require some “smoothing” (they’re not perfectly normal at every age, but they’re pretty close). In the test technical manual, the major IQ test companies tell you how they collect their samples. but much of the actual data is proprietary. It would amaze most people how good & accurate the data are at these companies, & the extreme lengths they go to in accurately standardizing their tests. I hated working there, btw. but to their credit, they are way more anal retentive than they need to be!
Mr. Thompson,
I found another potential and, I believe, very plausible explanation for smart fractions, performance super-stars and racial and/or cultural differences in achievement.
Even if we assume that intellectual (and emotional intelligence) is normally distributed, that does not mean, in my opinion, that there is an absolute correlation between the two (see Figure 1 below), meaning that not every intelligent person is also, automatically, emotionally intelligent. Overachievers likely score high on BOTH intellectual AND emotional intelligence, i.e. the 80/20 rule and power law distribution. This rule also applies to differences in achievement outcomes between racial/ethnic groups (see studies below, whites score higher than blacks and Asians on emotional intelligence tests).
Distributed neural system for emotional intelligence revealed by lesion mapping
Regression analyses revealed that latent scores for measures of general intelligence and personality reliably predicted latent scores for emotional intelligence.
https://academic.oup.com/scan/article/9/3/265/1660017
Figure 1:
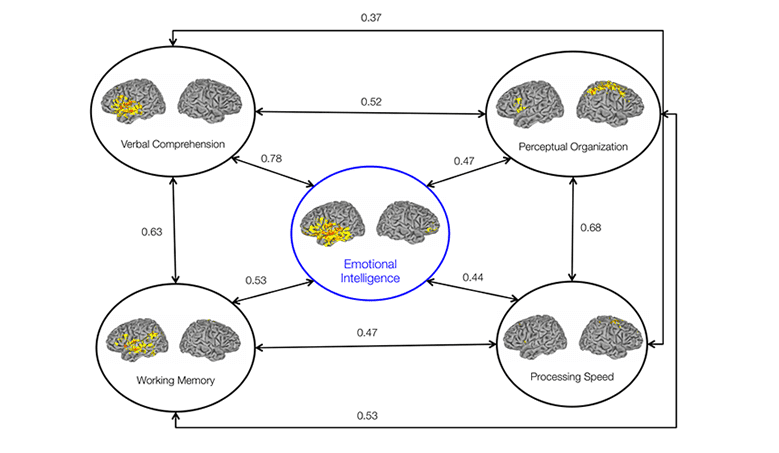
Source: https://www.decisionneurosciencelab.org/distributed-neural-system-for-emotional-intelligence-revealed-by-lesion-mapping/ Archived link: http://archive.is/KuvNB
– https://hbr.org/2014/10/ignore-emotional-intelligence-at-you-own-risk
– https://www.amren.com/news/2014/08/emotional-intelligence-among-black-and-white-job-applicants/
Emotional Intelligence and Culture Difference between First Year Radiography Students: an International Perspective
Statistically significant differences in Global EI (p = 0.02), Wellbeing (p = 0.002) and Sociability (p = 0.003) were found with Western versus Asian cultures being a key factor.
https://www.researchgate.net/publication/262715833_Emotional_Intelligence_and_Culture_Difference_between_First_Year_Radiography_Students_an_International_Perspective
A cross-cultural investigation of trait emotional intelligence in Hong Kong and the UK
Gokcen, et al. (2014)
In addition, results showed pronounced cross-cultural variation in global trait EI scores, with British participants scoring consistently higher than their Chinese counterparts.
http://www.psychometriclab.com/adminsdata/files/PAID%20-%20trait%20EI%20(2014).pdf
did you get a feeling for how many items which were good discriminators in practice had to be turned down on the basis of presumed cultural bias? That is, how hard did test constructors have to work to achieve “balance” between the sexes, and to reduce racial differences as required by general legislation?
The MSCEIT (EI test) was new to me. Since there is a scarcity of tests to measure EI I looked into it a bit.
Description of the test: http://www.eiconsortium.org/measures/msceit.html
Wikipedia: https://en.wikipedia.org/wiki/Mayer-Salovey-Caruso_Emotional_Intelligence_Test
Book chapter about EI. Reads like a textbook to me and has copious references: https://www.researchgate.net/publication/5907081_Human_Abilities_Emotional_Intelligence
What Is the Ability Emotional Intelligence Test (MSCEIT) Good for? An Evaluation Using Item Response Theory
http://journals.plos.org/plosone/article?id=10.1371/journal.pone.0098827
One thing that should be made very clear is that the paper supplying your graphic is NOT a typical cross section of people (i.e. it is a very nonrepresentative sample) and has a fairly small sample size:
IMHO their results should not be carelessly extrapolated to the general population. Nonetheless, the results are suggestive.
“When the appointees excelled in experience and IQ but had low emotional intelligence, their failure rate was as high as 25%.”
Like rubbing the boss in the wrong ways? https://www.theguardian.com/us-news/2018/mar/13/rex-tillerson-fired-donald-trump “””Trump was asked twice if he had fired Tillerson “because he called you a moron?” The president twice said he could not hear the question””” Thats how you get fired when you are smarter than the boss.
“However, those people with high emotional intelligence combined with at least one of the other two factors (experience or IQ) only failed in 3%-4% of the cases.”
Like know how to suck up to the boss?
“However, highly intelligent or experienced candidates who lacked emotional intelligence were more likely to flame out.”
Like Steve Jobs was once fired by the Apple Inc. board of directors.
“the right motivation, curiosity, insight, engagement, and determination — are also heavily based on emotional intelligence.”
Slight of hand comment without basis. For MSCEIT the four branches of EI tests are: 1) Perceiving Emotions, 2) Facilitating Thought, 3) Understanding Emotions and 4) Managing Emotions, none of them are about motivation, curiosity, insight, engagement, and determination. Emotions can be faked. Relying on them to make decisions will most probably end up being gamed by others. Make All Gullible Again. “””In a study by Føllesdal,[47] the MSCEIT test results of 111 business leaders were compared with how their employees described their leader. It was found that there were no correlations between a leader’s test results and how he or she was rated by the employees, with regard to empathy, ability to motivate, and leader effectiveness.”””, i.e. the business leaders know how to game the test.
Furthermore, “””the MSCEIT is unlike standard IQ tests in that its items do not have objectively correct responses. … responses are deemed emotionally “intelligent” only if the majority of the sample has endorsed them“””, i.e. the measurement of “group think”, antithesis of creativeness.
“In sum, you can choose to ignore EI — but make sure you understand the risks.”
As management consultants, know which side of the bread is buttered.
great question! each subtest lost about 1 to 4 items along the way for not “behaving” quite the same for males & females 🙂 unless taking them away left a huge gap/jump between item difficulty level overall – equal gradients between item difficulty was the ideal, but that’s pretty impossible. however, it was always items “biased against” females that were removed (most of them – not all of them:) items biased against males were left in. & of course, for each “ethnic group” items tended to behave the same way – items hardest for 1 group were hardest for another, etc.
re: regional US differences between items, those were lower priority but were taken out occasionally (unless it plugged a hole in item difficulty level 🙂 now regionally biased items get left in – ostensibly so item difficulty level gradients look nice (e.g., sea-faring/coastline related items may be left in but are clearly biased against so called flyover country in the US!) but really, so there’s more reason to eventually make/sell a new version of the test!
some bad items, especially items quickly out of date (e.g., questions about 1980s technology), get left in – so test companies have MORE of a reason to renorm (!) since companies can no longer count on the “flynn/lynn effect” as a reason to renorm – that used to serve as an obvious reason to renorm (& make lots of money off the new test!) BUT, now they’ll need new excuses to renorm tests every 12 years or so. heaven forbid the norms on a test stay good for 30 or 40 years! how will the test companies make money? 🙂 now they leave in some items that are obviously regionally biased & some items that will obviously age quickly, so they’ll have a reason to make a newer version of the test! it is a business (but they really do a good anal-retentive job at what they do:)
alas, even if the norms stayed accurate for 30-40 years, test consumers themselves would think they needed a NEW test & somehow demand a newer test. me, i’d prefer never to buy another test again!
Thanks for a most informative answer. I had no idea the rate of rejection of items was so high.
Here’s a trifling idea. Is everyone who took an “11 plus” IQ test entitled to submit a Freedom of Information request to be told the result? It’s trifling because the records were presumably destroyed decades ago. Were any kept for research purposes? They presumably might have been enormously valuable for that.